Меню:
Google Performance Tools (GPT) — is a set of tools, that allow to make performance analysis, analyse memory allocation and find memory leaks.
Installation
GPT works on almost all Unix-like operating systems — Linux, FreeBSD, Solaris, Mac OS X
(Darwin), including support for different processors1 — x86, x86_64 & PowerPC. Besides
this, user can compile tcmalloc on MS Windows and perform memory allocation analysis and
memory leaks detection for programs, that works under MS Windows.
Installation on Unix-like systems is very easy — package use standard autotools infrastructure, so you just need to download sources from project's site and perform following commands:
./configure
make
make install
that will configure sources, build and install programs and libraries. You can install
package to any destination, using command-line options to ./configure.2
Basics of work with GPT
Google Performance Tools consists from two libraries3:
- tcmalloc (Thread-Caching Malloc)
- tcmalloc — very quick implementation of
mallocfunction (much faster thanmallocin glibc 2.3). This library is used to analyse memory consumption and search for memory leaks. On the project's site you can read about internal structure of tcmalloc. - profiler
- this library implements performance analysis of executable code.
User can use these libraries any of two ways — either supply library name during linking
of code (using -l flag), or by loading it with LD_PRELOAD. Package's developers recommend
to use first way, and use second only if you doesn't have access to source code.
I need to mention, that loading (or linking) of libraries doesn't enable profiling
functions automatically. To enable these functions, you need to set some environment
variables, that are described below. During some operations, libraries can create text
files, that will hold collected information. To analyze these data, there is pprof
utility, that also described below.
Developers also can use functions from GPT in their programs to enable or disable checks in some places of programs. Information about these functions you can find in package's documentation.
Finding memory leaks
Searching for memory leaks with tcmalloc is very simple — you need to link program with
this library, and run it as in following example:
# HEAPCHECK=normal ./your-program
or as in this example (with linking):
# LD_PRELOAD=/usr/lib/libtcmalloc.so.0.0.0 HEAPCHECK=normal ./your-program
and after program's finish you get a report about found memory leaks. For example:
# LD_PRELOAD=/usr/lib/libtcmalloc.so.0.0.0 HEAPCHECK=normal ./test-hashes 1000000

HeapChecker: Starting check "_main_"
HeapChecker: Ignoring 12 reachable objects of 275 bytes
.... Вывод программы .....
HeapChecker: Checking for whole-program memory leaks
HeapChecker: Ending check "_main_"
HeapChecker: Ignoring 32 reachable objects of 1679 bytes
HeapChecker: Heap memory leaks of 1000 bytes and/or 1 allocations detected by check "_main_".

HeapChecker: To investigate leaks manually use e.g.
cd /home/ott/projects/cpp-tests; /usr/bin/pprof ./test-hashes \
  "/tmp/test-hashes.2977._main_-end.heap"  \
  --inuse_objects --lines --edgefraction=1e-10 --nodefraction=1e-10 --gv 2>/dev/null

HeapChecker: Below is this pprof's output:

       1 100.0% 100.0%        1 100.0% main test-hashes.cpp:106
       0   0.0% 100.0%        1 100.0% 0xb7c8d450 ??:0
       0   0.0% 100.0%        1 100.0% _start ??:0


HeapChecker: crashing because of leaks
[1]    2977 segmentation fault (core dumped)  LD_PRELOAD=/usr/lib/libtcmalloc.so.0.0.0
           HEAPCHECK=normal ./test-hashes
Please mention, that when you search for memory leaks, you get report immediately (you can change some parameters, as some data are written to temporary file). User can also specify additional environment variables that could change library's behaviour and/or get additional information about program's work (this is described below).
The HEAPCHECK environment variable sets level of checks, that will applied during
execution. This variable can has one of four values —
minimal, normal, strict and
draconian — from the simplest one to strictest, that could lead to slow execution of
program. Besides this, there are also two additional modes: as-is — when user can
specify which checks should be executed, and local — when checks are performed only for
code, that explicitly marked for checking (this is performed by adding calls to GPT's
functions to source code).
After the finding of memory leak (as in our example above) library terminates program, and
prints call stack for functions, that lead to this memory leak. In our example, memory
leak is in main function, at 106th line of code in file test-hashes.cpp.
During its work, library also use following environment variables (if they set), that are defined for all checks levels:
HEAP_CHECK_REPORT- (true or false, by default: true), defines should report be printed on screen or not;
HEAP_CHECK_STRICT_CHECK- (true or false, by default: true), selects which function will
be used to checks —
SameHeaporNoLeaks; HEAP_CHECK_IDENTIFY_LEAKS- (true or false, by default: false), allows to get addresses of "leaked" objects;
HEAP_CHECK_TEST_POINTER_ALIGNMENT- (true or false, by default: false), check is memory leaks arise due non-aligned pointers or not;
PPROF_PATH- specify path to
pprofutility; HEAP_CHECK_DUMP_DIRECTORY- specify path to directory, where temporary files will created.
Additional information about memory leaks checking and about as-is and local modes, you
can find in following document.
Analyse memory consumption
Besides finding memory leaks, the tcmalloc library can analyse program's memory
consumption (memory profiling). To perform this task library checks allocations and
de-allocations of all memory blocks. Library can check following memory allocation
functions —
malloc, calloc, realloc and new.
The procedure of memory consumption analysis is almost same as procedure for memory leaks
searching, and differs only in names of environment variables. All data collected by
library are stored in file, specified by HEAPPROFILE environment variable. For example:
LD_PRELOAD=/usr/lib/libtcmalloc.so.0.0.0 HEAPPROFILE=gpt-heapprofile.log ./your-program
All data, collected during library's work are available for analysis after program's
execution is finished. Analysis is performed with pprof utility, described below. Data,
processed by this utility could be obtained in text or graphical form. These data
includes statistic about memory allocations in program (and their functions), and also
information about relationships between functions of program.
By setting additional environment variables, we can change library's behaviour, for
example, it can also analyse mmap calls in addition to analysis of standard memory
allocation functions (this happen, if you set HEAP_PROFILE_MMAP environment variable to
true).
Description of additional environment variables, and also examples of data analysis you can find at documentation.
Performance analysis
To use profiler, you need just to link your program with profiler library, and specify
file name for data in the CPUPROFILE environment variables, as here:
# CPUPROFILE=/tmp/cpuprofile.log ./your-program
or without linking of the library:
# LD_PRELOAD=/usr/lib/libprofiler.so.0.0.0 CPUPROFILE=/tmp/cpuprofile.log ./your-program
Besides CPUPROFILE variable, you can set additional environment variables, that could be
used to control library's behaviour. For example, the CPUPROFILE_FREQUENCY variable could
be used to set number of probes, performed by library every second.
After finish of program, collected results are stored in your file, and you can perform
its analysis with pprof utility. You can get analysed data either in text form:
23 2.4% 42.6% 309 32.4% std::less::operator
or in graphical form (this is only part of graph, generated by pprof):
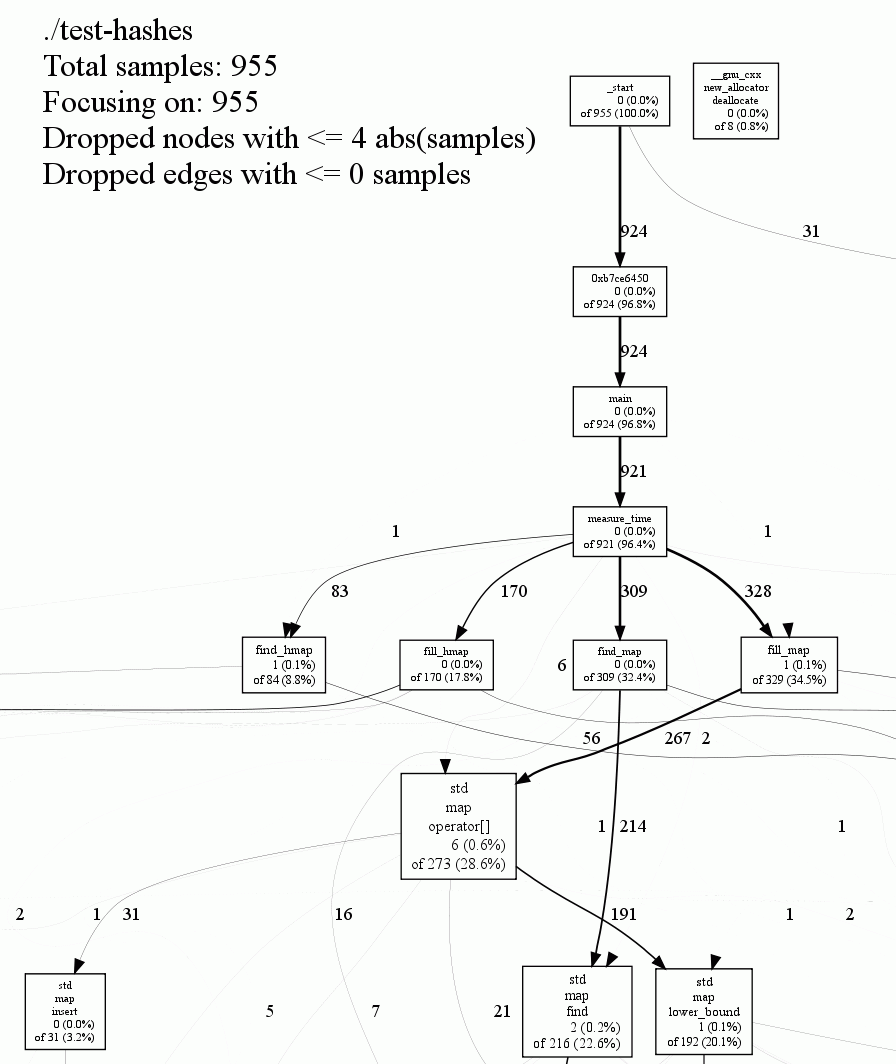
When you get data in text form, then pprof utility prints list of functions, and for each
function following information is specified (in corresponding column):
- Number of checks in this function
- Percentage of checks in this function
- Percentage of checks in the functions printed so far
- Number of checks in this function and its callees
- Percentage of checks in this function and its callees
- Function name
When you get information in graphical form, then besides this information (function names, number of checks, etc.), you also get information about function's relationship.
You can get more detailed information about cpu profiler and analysis of its data on the project's site.
The pprof utility
The pprof utility is used to perform analysis of data, collected by cpu and memory
profiling routines. Command line is looks like:
pprof [options] program_name results_file_name
Some of options are common for all files, but other are specific for concrete mode.
Common options allow to specify format and details level of output information — the
--addresses, --lines, --functions (by default) or --files options specify which details
will printed — physical address, line of code, function or file with source code.
Utility can output information either in text (--text option), or in graphical form
(--gif, --ps, --pdf and other options). You can also select output in form of annotated
source code (--list option), or in form of disassembled machine code (--disasm option).
If you doesn't specify output format, then utility starts to work in interactive mode,
where you can use different commands, those names are match to command-line options
(without -- sign).
When you analyse data, collected by memory profiler, you can use additional options, that
allow to display counts of used and/or allocated objects (--inuse_objects and/or
--alloc_objects), information about allocated memory (--alloc_space), and use bytes
instead of megabytes in reports (--show_bytes option).
When you analyse data from cpu profiler, you can use options, controlling details level.
For example, with --ignore option you can exclude objects, those names match specified
regular expression. There are also --nodecount, --nodefraction and --edgefraction
options, that control details level for graphics.
Full description of pprof utility you can find at manual page, that come in distribution.
And more examples you can find in documentation, that describes GPT's components.
1. There are some specific details when you use GPT 64-bit systems. You can find their
description in the INSTALL file, in GPT's distribution.
2. To use package on MS Windows you need to download special distribution, that contains
project files for building with Visual C++. Additional information you can also find
in README.windows file, that come together with source code.
3. Both libraries could be used in multi-threaded programs without any restrictions.
Last change: 05.03.2013 16:54
Copyright © 1997-2011Alex Ott · Design by Andreas Viklund · 