Меню:
Introduction
Valgrind is well-known as a tool for finding errors of work with memory. But except this, it also contain number of additional utilities for performance profiling, finding synchronization errors in multi-threading programs and analysis of memory consumption.
This article contain short description of work with Valgrind and usage of its modules. This description match Valgrind version 3.3. Additional information about work with Valgrind you can find on Valgrind's site, that contains different manuals, from easy Quick Start to very detailed user manual and technical description of Valgrind.
Architecture of Valgrind
Valgrind has modular architecture and consists from kernel, that perform processor emulation, and modules, that collect and analyze information, obtained from the kernel during execution of analyzed code. Valgrind works under Linux on x86, amd64, ppc32 and ppc64 processors (i need to mention, that exists projects for porting Valgrind to other OSes), and exists some limitations, that could affect work of analyzed programs.1
Valgrind's distribution contain following modules:
- memcheck
- main module, that provide memory leak detection. This module also could be used for finding other errors of work with memory — read or write behind memory blocks boundaries, etc.
- cachegrind
- analyze execution of code, collecting data about processor cache misses and code branching (when processor has wrong prediction about jumping). This statistic collecting for all program, separate functions and lines of code
- callgrind
- analyze functions calls, using almost same methods, as cachegrind module. This allow to build tree of functions calls, and analyze performance
- massif
- allow to analyze memory consumption in different parts of program
- helgrind
- analyze executed code for presence of different synchronization errors in programs, that use POSIX Threads.
There are also some number of modules, but they are experimental. Users also can create their own modules, that could perform analysis of executed code.
Starting to work with Valgrind
Currently, Valgrind packaged for almost all Linux distributions, and installation from sources required only in very rare cases, so I skip description of this process2.
Work with Valgrind is pretty simple — you can control its behaviour via command-line
options and doesn't require to make changes in analyzed program (although it's better to
rebuild program with debug information and disabled optimisation of code using compilers
flags -g and -O0). If program usually run with "./command arguments", then to run it
under Valgrind, you need to add to the start of this command line work valgrind, and
specify needed options. For example, if you use following command line:
valgrind --leak-check=full --leak-resolution=med ./command arguments
then this will run your program with all passed argument in memory leak finding mode.
By default Valgrind run memcheck module, but user can select another module by specifying
it with --tool option passing it the name of module, for example:
valgrind --tool=callgrind ./test
I need to mention, that often used options you can specify once, using configuration file
(by default this is ~/.valgrindrc), so it wouldn't required to specify these options in
each run of Valgrind.
Common options
Some of command-line options are common for all modules. To often used options we could relate following3:
--quiet- (or
-q) disable output of additional information, leave only messages about errors. --verbose- (or
-v) enable output of additional information about Valgrind's work. --log-file- allow to specify name of file to which output will redirected. In this
name user can use different substitution templates, that will replaced with actual
values. For example,
%ptemplate is used to specify process identifier (pid). --log-socket- allow to specify host and port to which output will redirected.
--log-fd- allow to specify file descriptor to which output will redirected (by default
this is
2— standard stream for error messages). --track-fds- (
yesorno, by defaultno) force Valgrind to output list of open files when finishing the work. --trace-children- (
yesorno, by defaultno) enable tracing of processes, created by analyzed program withexecsystem call. --time-stamp- (
yesorno, by defaultno) inserts timestamps into output (time is counted from start of program).
Options for errors control
Valgrind's user has number of options to control errors processing — starting from options for control of output format, and finishing with options for control stack size.
By default Valgrind prints call stack when error happens. Default depth of call stack is
12, but you can change this value with --num-callers option. And I need to mention, that
increasing of this parameter will lead to slowdown of Valgrind's performance.
User can also control how many errors will be printed by Valgrind. For this task there is
option --error-limit (yes or no, by default yes), that allow to limit number of printed
errors with 1000 of different errors. If user doesn't restrict number of printed errors,
this also will has impact on performance.
Besides this, user can also control which errors will be printed to output, and which not.
It could be done by specifying special directives called suppressions, that stored in
files, which could be passed to Valgrind via --suppressions option. In Valgrind's
distribution there is such file (usually this is /usr/lib/valgrind/default.supp), in which
specified known errors for glibc. And user can also create their own suppression file.
He can use --gen-suppressions option, that will ask user about generate suppression for
given error or no.
User also able to run debugger when error is occur. This is controlled by --db-attach
(yes or no, by default no) option, that, if user enables it, will ask about attaching
debugger to process. You can set debugger command-line options with --db-command option,
but default value is enough for most of cases.
Finding memory leaks
Valgrind become popularity mostly as a tool for finding memory leaks in programs. This functionality is implemented by memcheck module, that has special options for rule checking process.
--leak-check- enable (valid values are
yes,summaryorfull) or disable (valueno) memory leak detection function. I need to mention, that if user selectssummarymode, then memcheck prints only short information about memory leaks, while in other modes, besides summary information, detailed information about places where memory leaks happens also printed. --leak-resolution- (valid values are
low,medorhigh) specify method for comparison of function call stacks. Withlowandmedvalues call stacks are compared using only 2 or 4 last calls, and whenhighvalue is specified, then all function calls in call stacks are compared. This option affects only results representation. --undef-value-errors- (
yesorno) defines, will reported errors about non-initialized values, or not.
Other options are used rarely, and you can find their description in users manual, if this is necessary.
Interpretation of results
There are several types of errors detected by memcheck module. Readings and writings behind boundaries of memory blocks (and some other errors) reported immediately, when they happen. But errors, leading to memory leaks, printed by Valgrind only when program is finished. Output format for these errors slightly differs, so they will described separately.
Each line in Valgrind's output has following prefix
==12345==where number is process identifier (pid).
Types of errors of work with memory
During its work memcheck module detect following types of errors of work with memory:
- reading or writing at wrong memory addresses — behind memory blocks boundaries, etc.
- usage of non-initialized values, also for variables allocated on stack
- errors of memory release, for example, when memory block was already released
- usage of "wrong" function to release memory, for example, usage of
deletefor memory allocated withnew [] - pass of incorrect parameters to system calls, for example, passing of wrong pointers to memory blocks for read operation, etc.
- overlapping of memory block boundaries during copy/move operations between two blocks of memory.
All these errors reported immediately, and usually they looks like this:
Mismatched free() / delete / delete []
   at 0x40043249: free (vg_clientfuncs.c:171)
   by 0x4102BB4E: QGArray::~QGArray(void) (tools/qgarray.cpp:149)
   by 0x4C261C41: PptDoc::~PptDoc(void) (include/qmemarray.h:60)
   by 0x4C261F0E: PptXml::~PptXml(void) (pptxml.cc:44)
 Address 0x4BB292A8 is 0 bytes inside a block of size 64 alloc'd
   at 0x4004318C: operator new[](unsigned int) (vg_clientfuncs.c:152)
   by 0x4C21BC15: KLaola::readSBStream(int) const (klaola.cc:314)
   by 0x4C21C155: KLaola::stream(KLaola::OLENode const *) (klaola.cc:416)
   by 0x4C21788F: OLEFilter::convert(QCString const &) (olefilter.cc:272)
First line describes the corresponding error, and below it function call stack is printed. If it necessary, then also printed data about place where memory block was allocated.
Finding memory leaks
When analyzed program is finished Valgrind prints summary information, that describe number of errors was found, and information about memory allocations. For example:
ERROR SUMMARY: 2569904 errors from 493 contexts (suppressed: 17962 from 9)
malloc/free: in use at exit: 85,066,939 bytes in 313,004 blocks.
malloc/free: 10,552,914 allocs, 10,239,910 frees, 565,747,810 bytes allocated.
For counts of detected errors, rerun with: -v
searching for pointers to 313,004 not-freed blocks.
checked 117,623,772 bytes.
And in the end of report, also printed summary information about each type of "leaked" memory:
LEAK SUMMARY:
   definitely lost: 2,260 bytes in 47 blocks.
   indirectly lost: 1,680 bytes in 66 blocks.
     possibly lost: 2,703,124 bytes in 13,791 blocks.
   still reachable: 82,359,875 bytes in 299,100 blocks.
        suppressed: 0 bytes in 0 blocks.
Definitely lost means, that Valgrind had found memory block to which there is no pointers,
i.e. programmer doesn't release memory. Possibly lost means, that was found a pointer to
some memory block, but Valgrind is not sure, that pointer to the start of memory block is
exists (this could happen when programmer manipulate with pointers). Still reachable
usually means, that Valgrind found a pointer to the start of not released memory block
(this happens when pointers are stored in global variables, etc.). Usually this
information printed only when Valgrind is run with enabled --show-reachable option.
Between these two summary blocks Valgrind outputs details for each of found errors. For example:
756 bytes in 27 blocks are definitely lost in loss record 1,077 of 1,267
   at 0x4022AB8: malloc (vg_replace_malloc.c:207)
   by 0x7C485DA: __libc_res_nsend (res_send.c:425)
   by 0x7C47276: __libc_res_nquery (res_query.c:171)
   by 0x7C47B5B: __res_nquery (res_query.c:223)
   by 0x834A618: LookUp::LookUp(std::string&) (LookUp.cpp:83)
   by 0x8637C29: ClientThread::Connect(LogFileEntry&) (ClientThread.cpp:359)
   by 0x86394D5: ClientThread::Run() (ClientThread.cpp:215)
   by 0x80FD839: Thread::StartRunLoop(void*) (Thread.cpp:315)
   by 0x4163FD9: start_thread (pthread_create.c:297)
   by 0x43843AD: clone (in /usr/lib/debug/libc-2.7.so)
First line describes an error, also printing a block number in the list of potentially lost memory blocks and size of "lost" memory block. After string with description, Valgrind prints calls stack of functions that produce this "lost" memory block. This list provide enough details to find point, where memory leak arise.
Useful tips for memcheck
- Absence of information about source code
- When you analyze programs that use loadable
modules, you can find, that Valgrind may not print information about code, that produce
memory leaks. This happens because at the time when Valgrind collects information
about memory usage, this module may be already unloaded from memory, and Valgrind can't
find debug information for it. This lead to situation, when in report user get
???instead of function names (question signs mean, that there is no debug information for this address). To avoid this situation you need not to usedlclosefunction for unloading of module when you finish program (but this will require to make changes in source code of program).
Profiling
To profile program user can use two modules — callgrind and cachegrind. Each of them collects different information. But when you are searching for bottlenecks you shouldn't rely on results, collected only by one of these modules and should analyze data collected by both modules.
cachegrind
Cachegrind module collects statistic about cache misses during reads and writes operations
for processor caches of first and second level. It also collects statistic about work of
processor's branch prediction module. By default collecting of this statistic (branch
prediction) is disabled, but you can enable it with --branch-sim option with value yes.
Besides this, user can specify additional options, for example, setting cache sizes, etc.
By default, all collected data will output to file cachegrind.out.<pid> (pid — process
identifier). If you want to use other file name, you can specify it with
--cachegrind-out-file option.
After finish of analyzed program, Valgrind prints summary with collected information. For example:
I   refs:      1,873,023
I1  misses:        2,222
L2i misses:        2,057
I1  miss rate:      0.11%
L2i miss rate:      0.10%

D   refs:        808,914  (578,685 rd   + 230,229 wr)
D1  misses:        9,785  (  9,212 rd   +     573 wr)
L2d misses:        5,119  (  4,757 rd   +     362 wr)
D1  miss rate:       1.2% (    1.5%     +     0.2%  )
L2d miss rate:       0.6% (    0.8%     +     0.1%  )

L2 refs:          12,007  ( 11,434 rd   +     573 wr)
L2 misses:         7,176  (  6,814 rd   +     362 wr)
L2 miss rate:        0.2% (    0.2%     +     0.1%  )
This summary list data about fetching of data and instructions performed by processor.
And the output file contains (this file is pretty big even for simple programs) detailed
data, that could be analyzed later to perform search of bottlenecks. Very useful utility
for analysis of this data is kcachegrind program (this is external utility), but
Valgrind's distribution also contains the cg_annotate utility, that allow to perform
analysis of program's performance4.
To get analyzed data you need to pass cg_annotate name of file with results, collected by
cachegrind, and (optionally) list of files with source code, that will be annotated by
cg_annotate. To make this work easier, user can pass cg_annotate an --auto option with
value yes, and utility will automatically looks for files with source code (with option -I
you can specify path to directories, where utility will look for source code).
cg_annotate outputs to screen an annotated source code, where each function (or line of
source code, depending on settings) will get a counts of reading and writings operations,
and some other information about work of this code. Using this information, developer can
analyse source code and perform optimisation of bottlenecks.
callgrind
This module allow to collect information about function calls in analyzed program. By default, this module collects information about amount of executed processor instructions, dependencies between caller and callee, and amount of calls for concrete functions. Besides this, for this module you can enable cache emulation, like in cachegrind, and collect additional statistic about memory accesses.
Collected data is stored in file callgrind.out.<pid>, that could be later analyzed with
kcachegrind or callgrind_annotate (from Valgrind's distribution) utilities.
callgrind_annotate outputs to screen data about functions execution and may present this
data in different forms, depending on command-line options. As for cg_annotate, you can
set option --auto, to avoid manual specification of file names with source code.
By default callgrind outputs information once, when analyzed program is finished. But
users can change this behaviour with callgrind_control utility (from Valgrind's
distribution) and get intermediate data by request or periodically.
Analysis of memory consumption
To analyze memory consumption user can use massif module. It collects data not only about sizes of memory blocks allocated by program, but also collects data about how much memory is used to hold auxiliary information.
After finish of program, that works under massif's control, Valgrind prints short summary
about memory consumption, and detailed data printed to massif.out.<pid> file. To analyze
them you can use ms_print utility from Valgrind's distribution. This program can output
data as a graphs, that demonstrate memory consumption during program's work. For example:
    MB
12.46^                                                            #... . ...
     |                                                            #::: : :::
     |                                                           :#::: : :::
     |                                                        .@ :#::: : :::
     |                                                      . :@ :#::: : :::
     |                                                     .: :@ :#::: : ::::
     |                                                    ::: :@ :#::: : ::::
     |                                                  : ::: :@ :#::: : ::::
     |                                                . : ::: :@ :#::: : ::::
     |                                              . : : ::: :@ :#::: : ::::
     |                          ,. .,..,.. ,.., . ,.: : : ::: :@ :#::: : ::::
     |                       . :@: :@::@:: @::@ : @:: : : ::: :@ :#::: : ::::,
     |                    . :: :@: :@::@:: @::@ : @:: : : ::: :@ :#::: : ::::@
     |                  .:: :: :@: :@::@:: @::@ : @:: : : ::: :@ :#::: : ::::@
     |               . :::: :: :@: :@::@:: @::@ : @:: : : ::: :@ :#::: : ::::@
     |            ,: : :::: :: :@: :@::@:: @::@ : @:: : : ::: :@ :#::: : ::::@
     |         . :@: : :::: :: :@: :@::@:: @::@ : @:: : : ::: :@ :#::: : ::::@
     |       ,:: :@: : :::: :: :@: :@::@:: @::@ : @:: : : ::: :@ :#::: : ::::@
     |    ,: @:: :@: : :::: :: :@: :@::@:: @::@ : @:: : : ::: :@ :#::: : ::::@
     |  : @: @:: :@: : :::: :: :@: :@::@:: @::@ : @:: : : ::: :@ :#::: : ::::@
   0 +----------------------------------------------------------------------->Gi
     0                                                                   3.539

Number of snapshots: 56
 Detailed snapshots: [3, 5, 9, 19, 22, 25, 28, 31, 33, 42, 44 (peak), 54]
User can specify additional massif's command-line option to control frequency of
snapshots, changing list of function, for which analysis will provided (for example, it's
possible to analyze only work of new or malloc), etc.
Finding synchronisation errors
This class of errors is detected by helgrind module. It allows to find synchronisation errors in programs written in C, C++ & Fortran languages, that use POSIX Thread API. Helgrind detects following types of errors:
- potential deadlocks, arising from inaccurate order of locks capture
- data races due inaccurate or missing locks for memory block accesses
- incorrect usage of POSIX API functions. This class of errors include different errors, for example, recursive capture of non-recursive lock, free of memory with object, containing mutex, etc.
Helgrind allows to find errors by analyzing state of every byte of memory, used by program, and by monitoring different events, related to threads execution — thread creation & destroying, obtaining and releasing of locks, etc.
Helgrind's output format is almost same as output format of memcheck module:
Possible data race during write of size 4 at 0x42B6530
   at 0x41E5027: _IO_file_sync@@GLIBC_2.1 (fileops.c:923)
   by 0x41D9B5F: fflush (iofflush.c:43)
   by 0x40C6941: __gnu_cxx::stdio_sync_filebuf<.... >::sync() (stdio_sync_filebuf.h:156)
   by 0x40D2B93: std::basic_streambuf<... >::pubsync() (streambuf:255)
   by 0x40C8573: std::ostream::flush() (ostream.tcc:514)
   by 0x40C863A: std::basic_ostream<... >& std::flush<...>(std::basic_ostream<...>&) (ostream:520)
   by 0x40CD025: std::basic_ostream<... >& std::endl<... >(std::basic_ostream<... >&) (ostream:499)
   by 0x40C74A0: std::ostream::operator<<(std::ostream& (*)(std::ostream&)) (ostream.tcc:72)
   by 0x804A208: f1(int) (test-threads.cpp:19)
   by 0x804A534: void boost::_bi::list1<... >::operator()<...>(.....) (bind.hpp:232)
   by 0x804A578: boost::_bi::bind_t<...>::operator()() (bind_template.hpp:20)
   by 0x804A592: boost::detail::function::void_function_obj_invoker0<...>::invoke(...&) (function_template.hpp:158)
  Old state: shared-readonly by threads #2, #3
  New state: shared-modified by threads #2, #3
  Reason:    this thread, #3, holds no consistent locks
  Location 0x42B6530 has never been protected by any lock
In this example, helgrind points to potential data race due simultaneous output of data to screen performed by several threads. Besides function calls stack that lead to error, helgrind also prints state of memory block before (old state) and after error (new state), and reason, why this error is happen (in our case — miss of locks for this memory block).
To control behaviour of this module there are number of options. They description available at Valgrind's user manual, but default values enough for work.
Additional tools for Valgrind
To simplify work with Valgrind there are several additional programs, implementing different tasks.
- The alleyoop program allow to work Valgrind using graphical user interface. It allow user to select necessary module and run Valgrind with specified options, and after finish of work, perform analysis of Valgrind's output and provide navigation over source code, that cause errors. Now this program support work with memcheck, helgrind, and cachegrind modules.
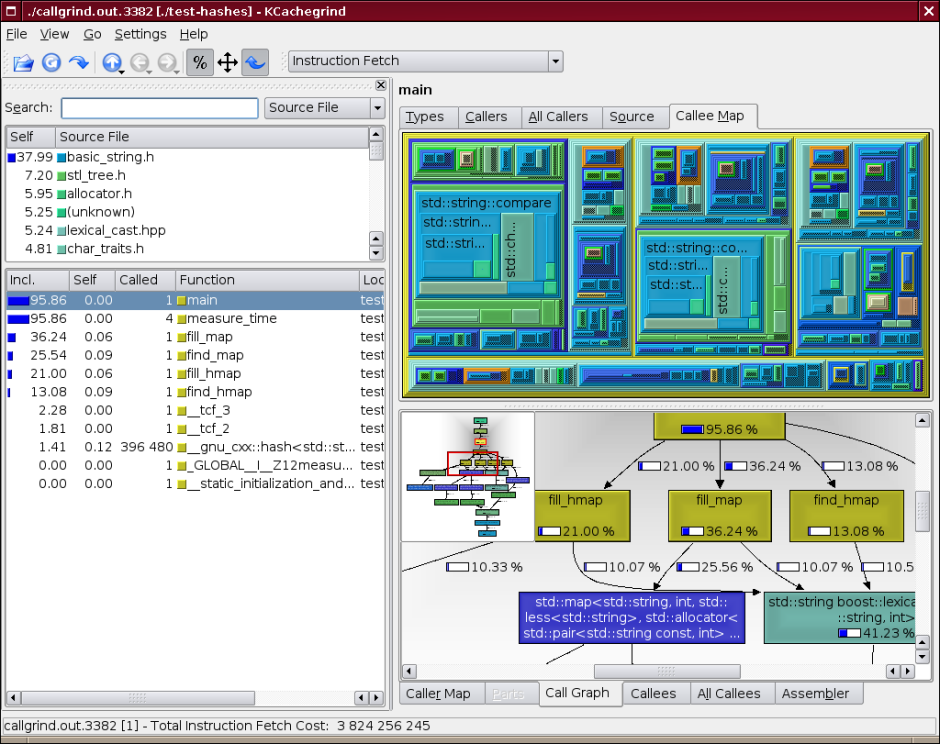
- To visualize collected from callgrind and cachegrind data there is additional tool called kcachegrind, that draw display data in user-friendly form and allow to navigate through source code. Kcachegrind allow to display data in different forms — as tables, maps & functions call graph. Example of interface you can see on picture below.
1. Good description of Valgrind's architecture and principles of work you can find in article Valgrind: A Framework for Heavyweight Dynamic Binary Instrumentation
2. Interested could find description of installation process in Valgrind's user manual.
3. For option specification the standard form is used. Some options has one-letter
aliases, and if they has arguments, then they separated from option by space symbol.
For long-named options, such as --log-file, arguments are specified after option,
using = symbol as separator of name and value.
4. In Valgrind's user manual there is description of cachegrind output data, so user able to write their own analyzers.
Last change: 05.03.2013 16:54
Copyright © 1997-2011Alex Ott · Design by Andreas Viklund · 